In This Article
- 1. What Is TSET and Why Monte Carlo Matters
- 2. Monte Carlo Simulation of TSET Beams
- 3. Beam Validation in TSET Delivery Geometry
- 4. Dose Uniformity and Patient Distributions
- 5. Monte Carlo in Brachytherapy: Beyond TG-43
- 6. MC Dose Calculation Tools for Brachytherapy
- 7. The Role of Imaging in Tissue Assignment for MC
What Is TSET and Why Monte Carlo Matters

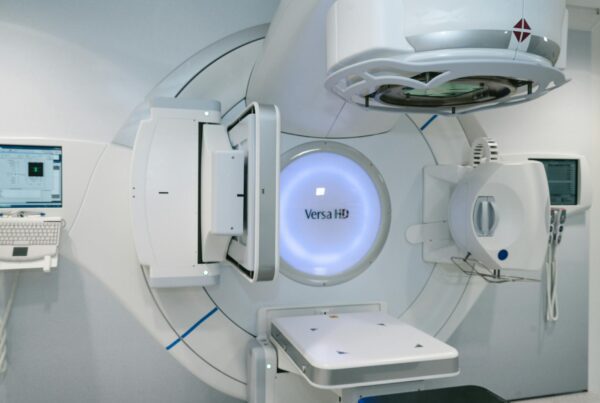
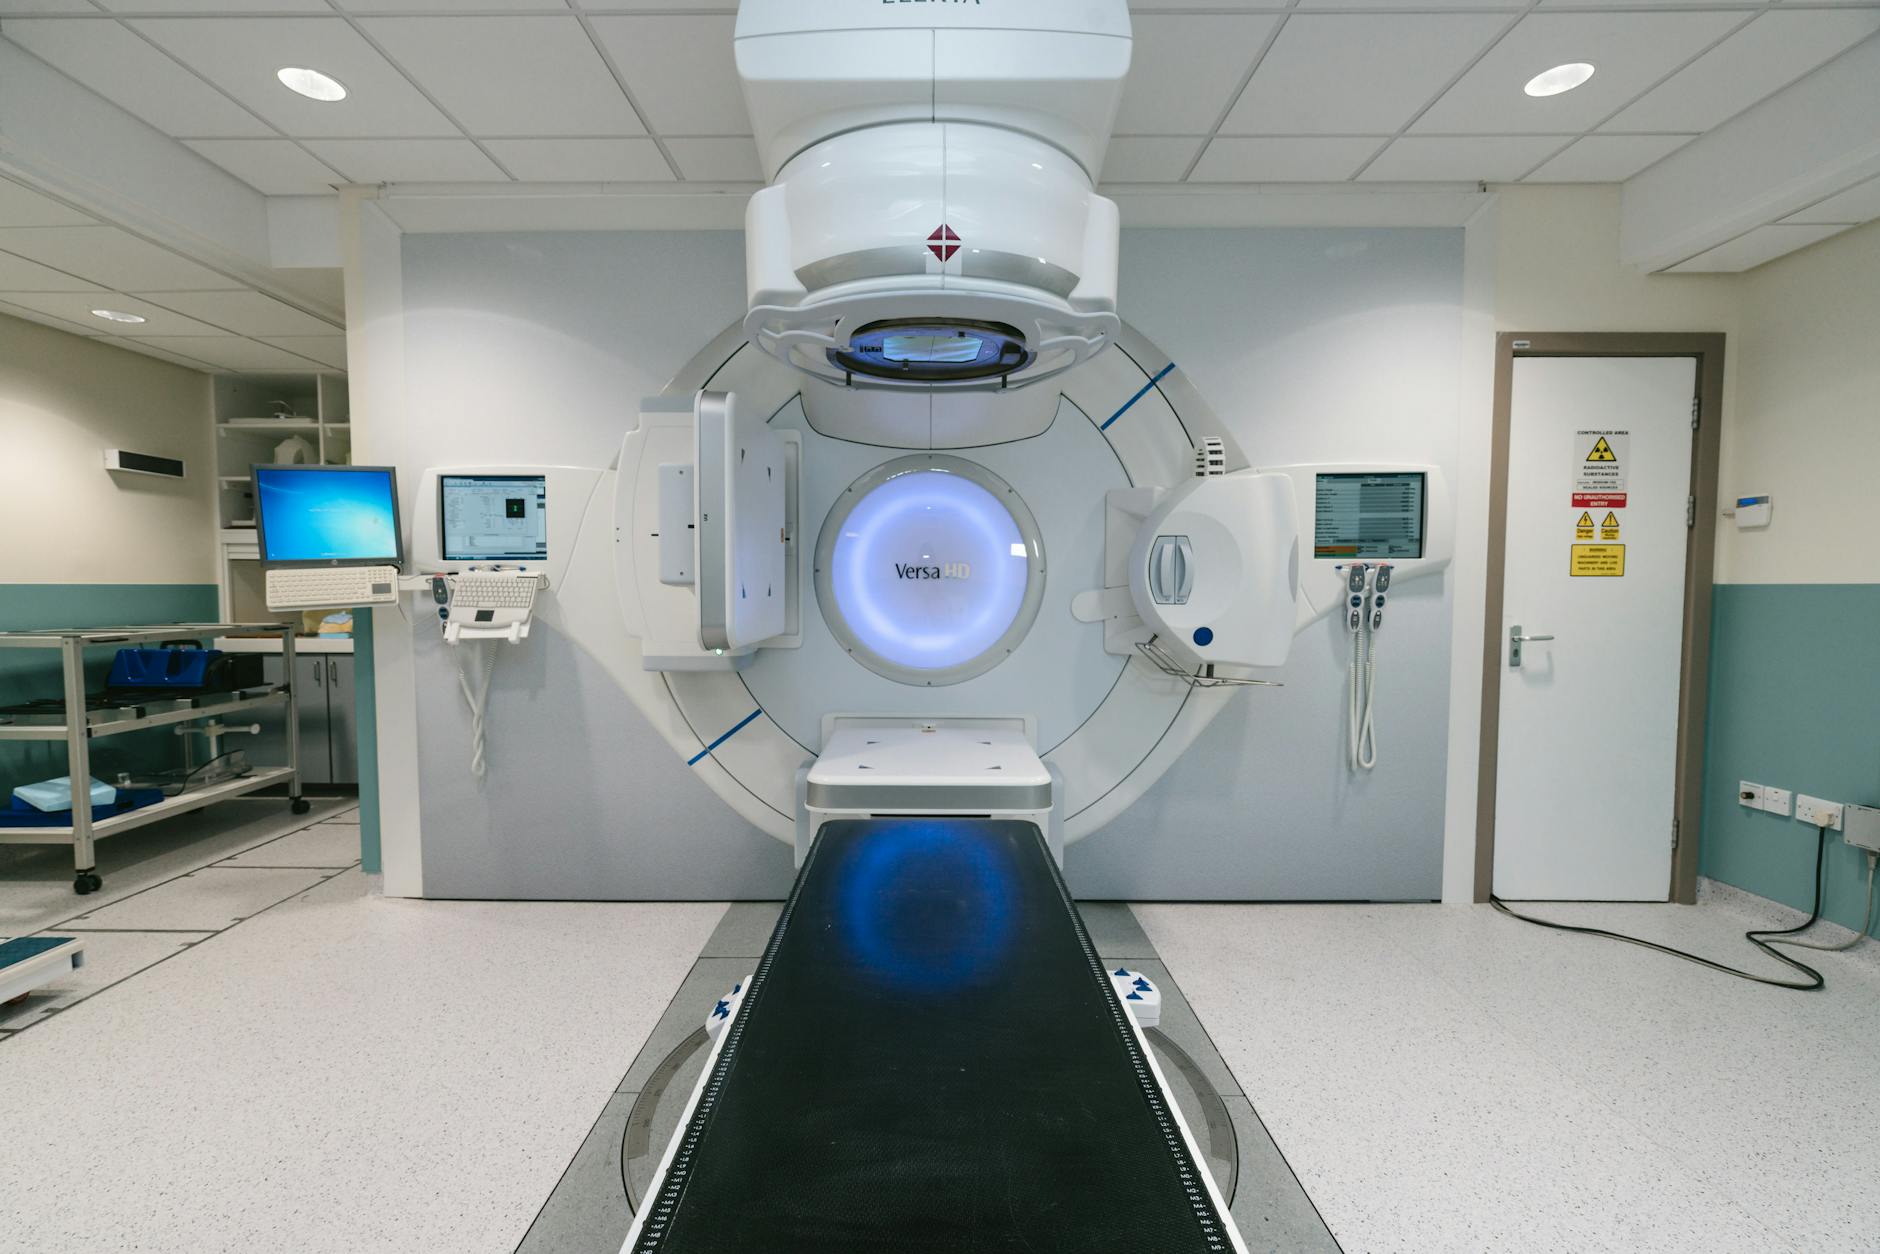
Total skin electron therapy (TSET) remains one of the most effective treatments for cutaneous T-cell lymphoma (mycosis fungoides). It requires specialized equipment modifications and an unconventional delivery geometry — composite electron beam fields approximately 200 cm high by 80 cm wide, with nominal SSDs ranging from 300 to 500 cm.
Series overview: for the full roadmap and related articles, return to the complete guide on Monte Carlo in radiotherapy.
Monte Carlo simulation brought something to TSET that decades of experimental dosimetry could not: a complete picture of patient skin dose distributions, including DVH analysis at different depths from the surface. Historically, dose information came from films, TLDs, and ionization chambers in phantoms — useful but fundamentally limited data.
The most commonly used nominal electron beam energy ranges from 4 to 9 MeV. Per AAPM Report 23 recommendations, the maximum dose should occur at the surface, the 80% dose level must reach beyond 0.4 cm depth, and the dose should fall below 20% at 2 cm depth. For a comprehensive overview, see our complete guide on Monte Carlo Techniques in Radiotherapy.
Monte Carlo Simulation of TSET Beams
TSET beam simulation uses the EGSnrc system, starting from the detailed geometry of the linac head. Ding et al. modeled 6 MeV beams from Varian Clinac 21EX and Varian TrueBeam accelerators — two machines requiring distinct simulation approaches.
For the Clinac 21EX, the simulation starts with electrons exiting the vacuum window. The energy and spot size of the electron beam hitting the exit window are adjusted to achieve the best agreement between measurements and calculations. For the TrueBeam, the starting point is phase-space files provided directly by Varian, scored at the plane just above the x-y jaw collimators — no adjustment needed.
Default EGSnrc parameters are used: $AE = ECUT = 0.521$ MeV, $AP = PCUT = 0.010$ MeV, with no photon interaction forcing and no Rayleigh scattering. The simulated beams, stored in phase-space files at SSD = 100 cm, serve as input for DOSXYZnrc dose calculations.
A key finding: Ding et al. did not observe significant bremsstrahlung dose increases at extended distances, contradicting the previously reported 5% value by Das et al. The bremsstrahlung dose for a 6 MeV beam ranged from 0.5% to 1% for SSDs of 100 to 700 cm. This has direct clinical impact — an overestimated bremsstrahlung dose could unnecessarily limit TSET use. For more on electron beam modeling, see our article on patient dose calculation and electron applications.
Beam Validation in TSET Delivery Geometry
Validation in the actual treatment geometry is mandatory. The technique uses rotational dual fields: the patient stands on a rotating platform while an acrylic scatter plate (90 cm x 200 cm) acts as a beam degrader, reducing electron energy and increasing scatter.
Validation measurements used nanoDot dosimeters (LANDAUER OSL technology) placed on a water-equivalent cylindrical phantom (29 cm diameter, 30 cm length) covered with two layers of 5 mm thick bolus. Dosimeters were positioned on the phantom surface and between the bolus layers.
The comparison between measured and calculated dose profiles on the scatter plate showed excellent agreement. The profiles are highly sensitive to field size. For the 40 x 40 cm² field, the dose at the edges is lower than for 36 x 36 cm² because both dual fields contribute to the dose at the center, while only a single field contributes at the edges.
Dose Uniformity and Patient Distributions
The human torso resembles an oval shape, and this irregular geometry directly impacts dose distribution. Monte Carlo simulations on an oval cylindrical phantom (40 cm long axis, 20 cm short axis) reveal significantly lower doses at the short-axis surfaces — corresponding to the anterior and posterior torso regions.
The scatter plate thickness directly influences depth-dose coverage. Simulations with 3 mm, 9 mm, and no plate show that the dose maximum occurs at the surface even without the plate, due to electrons hitting the phantom from multiple directions during rotation. Based on their Monte Carlo results, Ding et al. recommend a 3 mm plate with a 40 x 40 cm² field for optimal skin depth-dose coverage.
Patient dose distributions based on CT images show skin dose variations exceeding 20%, consistent with in vivo measurements reported in the literature. The 90%, 75%, and 50% isodose lines reveal partial shielding by the raised arms, creating coverage gaps between the head and arm regions.
DVH analysis at three depth intervals — 0-5 mm, 5-10 mm, and 10-15 mm from the surface — provides information no experimental method can obtain so comprehensively. Both the rotational and 6 static dual-field techniques produce comparable skin dose distributions.
Monte Carlo in Brachytherapy: Beyond TG-43
The TG-43 formalism was a landmark in brachytherapy dosimetry, standardizing parameters based on detailed source geometry. However, its inherent simplifications become problematic in specific situations. Single-source dose superposition ignores interseed attenuation (ISA), tissue heterogeneities, and applicator shielding effects.
| Anatomic Site | Source Energy | Absorption | Attenuation | Shielding | Scattering | Dose=Kerma Breakdown |
|---|---|---|---|---|---|---|
| Prostate | High | N | N | N | N | N |
| Prostate | Low | Y | Y | Y | N | N |
| Breast | High | N | N | N | Y | N |
| Breast | Low | Y | Y | Y | N | N |
| GYN | High | N | N | Y | N | N |
| Skin | High | N | N | Y | Y | N |
| Lungs | High | N | N | N | Y | Y |
| Eyes | High | N | N | Y | Y | Y |
| Eyes | Low | Y | Y | Y | Y | N |
Source: Monte Carlo Techniques in Radiation Therapy (2nd ed., CRC Press, 2022), Table 16.1, adapted from Rivard et al.
For low-energy sources, the mass energy-absorption coefficient $\mu_{en}/\rho$ varies significantly among tissues due to the approximate $Z^{3-4}$ dependence of the photoelectric cross section. Under charged particle equilibrium, $D_{tissue}/(\mu_{en}/\rho)_{tissue} = D_{water}/(\mu_{en}/\rho)_{water}$, meaning tissue doses can differ substantially from water doses.
The clinical impact is concrete. Carrier et al. demonstrated, in a retrospective study of 28 prostate cancer patients implanted with $^{125}$I, an average $D_{90}$ reduction of 7% when ISA and tissue heterogeneities are considered. Intraprostatic calcifications can cause $D_{90}$ reductions up to 25% relative to TG-43. For $^{103}$Pd breast implants, $D_{90}$ reductions range from 4% (all-glandular breast) to 35% (all-adipose breast). For more on source modeling, see our article on electron beams and brachytherapy source modeling.
MC Dose Calculation Tools for Brachytherapy
Several Monte Carlo dose calculation platforms have been developed for patient-specific brachytherapy dosimetry. Each brings a distinct approach to solving the same fundamental problem: overcoming TG-43 limitations with clinically viable calculation times.
| Tool | MC Engine | Voxel Size | Calculation Time | Statistical Uncertainty |
|---|---|---|---|---|
| MCPI | GEPTS | 2 mm³ | ~1 min | 2% |
| PTRAN_CT | EGSnrc (correlated sampling) | 2 mm³ | ~3 s | 2% |
| BrachyDose | EGSnrc | 2 mm³ | ~30 s | <2% |
| ALGEBRA | GEANT4 | 2 mm³ | 6-12 min | 2% |
| egs_brachy | EGSnrc (egs++) | 2 mm³ (prostate) / 1 mm³ (eye) | 13-39 s | 2% |
Source: Monte Carlo Techniques in Radiation Therapy (2nd ed., CRC Press, 2022)
PTRAN_CT deserves special mention for its correlated sampling implementation — photon histories are first constructed in homogeneous water, then particle weights are recalculated for the heterogeneous geometry. This increases efficiency by factors of 2 to 40.
egs_brachy, a modern EGSnrc application, is distributed as free, open-source software. It includes a benchmarked library of source, applicator, and phantom geometries with a graphical user interface for clinical data integration. For prostate and breast implants with 2 mm³ voxels and eye plaques with 1 mm³ voxels, simulation times range from 13 to 39 seconds for 2% average target dose uncertainty.
The Role of Imaging in Tissue Assignment for MC
Monte Carlo dose calculation accuracy depends directly on correct voxel-by-voxel photon cross-section assignment. Computed tomography (CT) provides attenuation data convertible to electron or mass density — a relatively straightforward step for high-energy sources where tissue composition effects are smaller.
For low-energy sources, the situation is more complex. Recent studies show that dual-energy CT (DECT) can provide more accurate estimates of tissue elemental composition, reducing uncertainties in cross-section assignment for MC simulations. MRI, with its excellent soft tissue contrast, offers alternatives for target contouring, though it does not directly provide electron density information.
Landry et al. investigated dose distribution sensitivity to tissue composition for $^{125}$I prostate and $^{103}$Pd breast implants. Two prostate tissue elemental compositions from the literature resulted in $D_{w,m,90\%}$ variations of 3.5%. For breast implants, tissue composition variability led to dose variations up to 10%. These numbers underscore that accurate tissue assignment is not merely a technical detail — it is a decisive factor in dosimetric accuracy.
The ongoing advancement of these techniques points toward a future where Monte Carlo calculations become routine tools in brachytherapy treatment planning, definitively surpassing TG-43 simplifications and delivering truly patient-specific dosimetry. For the latest trends, check our comprehensive guide on Monte Carlo techniques in radiotherapy.