
AI breast cancer detection models and short-term risk prediction models read the same mammogram, but they are not interchangeable. That is the finding of a study in Radiology: Imaging Cancer that tested four algorithms on 20,187 Swedish screening mammograms: each model did best at the task it was built for and lost ground outside it. The paper was discussed by breast radiologist Manisha Bahl of Massachusetts General Hospital and Harvard Medical School in her “Breast Imaging in Focus” column for Diagnostic Imaging.
What the study evaluated
The article, by Yao-Kuan Wang, Lesley Cockmartin, Tobias Wagner and colleagues, with Hilde Bosmans as senior author, brings together groups from KU Leuven and University Hospital Leuven (Belgium), the University of Ljubljana and the Jožef Stefan Institute (Slovenia), and the University of Wisconsin-Madison. It appeared in the September 2026 issue of the RSNA journal (2026;8(5):e250609).
The design is a retrospective case-control study. The dataset contains 20,187 mammograms from 7,430 women screened in Sweden between 2008 and 2016. Of these exams, 741 were followed by a breast cancer diagnosis within two years: 524 screen-detected cancers and 217 interval cancers, the tumors that surface clinically between one screening round and the next after an exam read as negative.
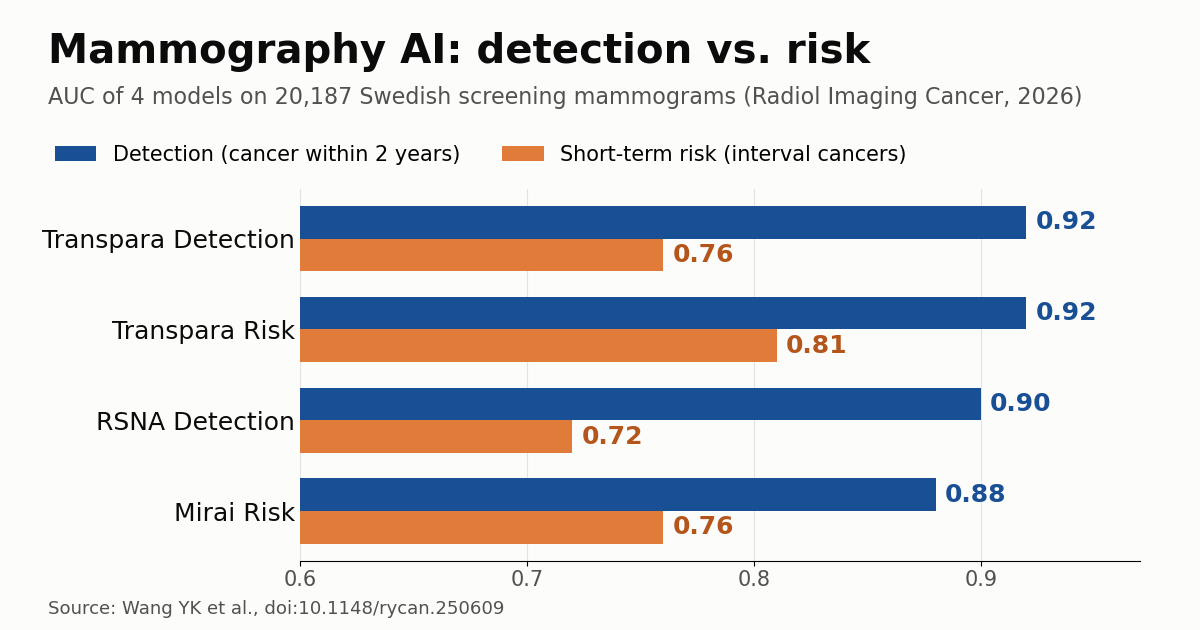
Four models were compared. Two are detection tools: Transpara Detection from ScreenPoint Medical, and a model labeled RSNA Detection. Two are risk tools: Transpara Risk, also from ScreenPoint, and Mirai, the image-based risk model developed at MIT. Each was run in two settings. The detection setting included both screen-detected and interval cancers. The short-term risk setting asked a different question: from a negative exam, which women would go on to have an interval cancer? Performance was measured with the area under the ROC curve (AUC) and with sensitivity and specificity at clinically relevant thresholds.
The three main findings
Detection: Transpara Detection and Transpara Risk tied at an AUC of 0.92, ahead of RSNA Detection (0.90) and Mirai (0.88). The tie hides an operational gap, though. With sensitivity fixed at the level of radiologist double reading, 70.7%, the detection model reached 97.1% specificity versus 94% for the risk model. In a screening program, three points of specificity translate into a lot of extra recalls.
Short-term risk: here the order flips. Transpara Risk reached an AUC of 0.81, compared with 0.76 for both Transpara Detection and Mirai and 0.72 for RSNA Detection. At a fixed 90% specificity, the risk model flagged 49.8% of interval cancers, against 41% for the detection model.
Agreement: the authors then cross-tabulated the two ScreenPoint models. At 90% specificity, only 11.1% of interval cancers were flagged by the risk model without also being flagged by the detection model, and 47.9% were missed by both. In other words, the tools overlap heavily, and nearly half of the hardest cases remain invisible to either one.
Why detection and risk are different tasks
A detection algorithm is trained to find what is already in the image: a mass, architectural distortion, microcalcifications. It answers “is there cancer on this exam?”. A short-term risk model answers a different question: “is this woman likely to develop cancer in the next few years?”. To do that, it learns more diffuse signals, such as density patterns, parenchymal texture and subtle asymmetries, which may precede a visible lesion or reflect a tumor still below the perceptual threshold.
Both outputs are usually a continuous score, so it is tempting to swap one for the other. The study shows why that is risky: similar AUCs do not guarantee similar behavior at the cutoff a service will actually use. AUC summarizes performance across all thresholds, while a screening program runs at one. The distinction has come up before on this blog, in the study that used Mirai to map how breast cancer risk evolves over time and in investor interest in image-based risk, as with the BCRF fund that backed Clairity.
Manisha Bahl’s take
In her column, Bahl draws three conclusions. The first is direct: detection and risk models should not be treated as interchangeable, even when their numbers overlap. The second is that risk AI could help select women who would benefit from supplemental screening, but it is not yet known whether that strategy raises cancer detection or lowers interval cancers. The third concerns combining the tools: because so few interval cancers were caught only by the risk model, the incremental gain of running both remains an open question.
Her bottom line is that these are related but distinct applications, and that each model should be selected and validated for its intended clinical purpose. She calls for prospective studies to determine whether building these algorithms into screening workflows improves patient outcomes.
Implications for breast imaging services
For anyone procuring or deploying mammography AI, the message is about governance. An algorithm cleared and validated as a lesion detector should not be repurposed as a risk stratifier without its own validation, and the reverse holds too. Thresholds need to be set for the task, with an eye on the recall rate the service can absorb. Programs such as Stockholm’s move to replace the second reader with AI, the workload reductions reported with screening AI and the specificity gains with Lunit’s AI are all about detection. Risk stratification is a different product that needs a different validation.
In Brazil and much of Latin America, where organized screening is still limited and many mammograms are opportunistic, image-based risk stratification is appealing because it could steer scarce resources, such as supplemental ultrasound or MRI, toward the women who need them most. The study, however, contains no Latin American data. Differences in population, equipment and screening interval make local validation mandatory before any such use.
Limitations
Bahl and the data themselves point to important caveats. The design is retrospective and case-control, and multiple exams from the same woman were included. The models were evaluated on their own, without the radiologist interaction that would occur in routine practice. Some clinical inputs required by the models had to be imputed. All exams came from a single mammography vendor and a Swedish population, which limits generalizability. Finally, the study measured algorithm performance, not clinical outcomes such as mortality or stage at diagnosis.
Even so, the work helps sharpen a conversation that often blurs concepts. The same image can feed two different questions, and getting the right answer depends on using the right tool at the right operating point.
Source: Diagnostic Imaging (Manisha Bahl column) and Wang YK et al., Radiology: Imaging Cancer 2026