
A cortical atrophy map applied to routine structural MRI was able to predict when — not merely whether — a person with mild cognitive impairment (MCI) due to early-onset Alzheimer’s disease will progress to dementia. The study, published August 26, 2026 in Neurology, found that each additional standard deviation of atrophy inside the so-called EOAD signature raised the risk of progression 1.24-fold, and did so independently of baseline clinical severity. For imaging professionals the message is blunt: the MRI already sitting in the dementia work-up carries quantitative information that a purely descriptive report throws away.
What the EOAD signature actually is
The EOAD (early-onset Alzheimer’s disease) signature is not a new exam and requires no exotic sequence. It is a map — an anatomical mask — applied to the volumetric T1-weighted MRI that most cognitive neuroimaging protocols already acquire. The mask delineates eight cortical regions that, in patients whose Alzheimer’s begins before age 65, shrink earlier and faster than the rest of the brain: medial and lateral parietal cortex, posterior lateral temporal cortex, and association areas tied to memory, language and reasoning.
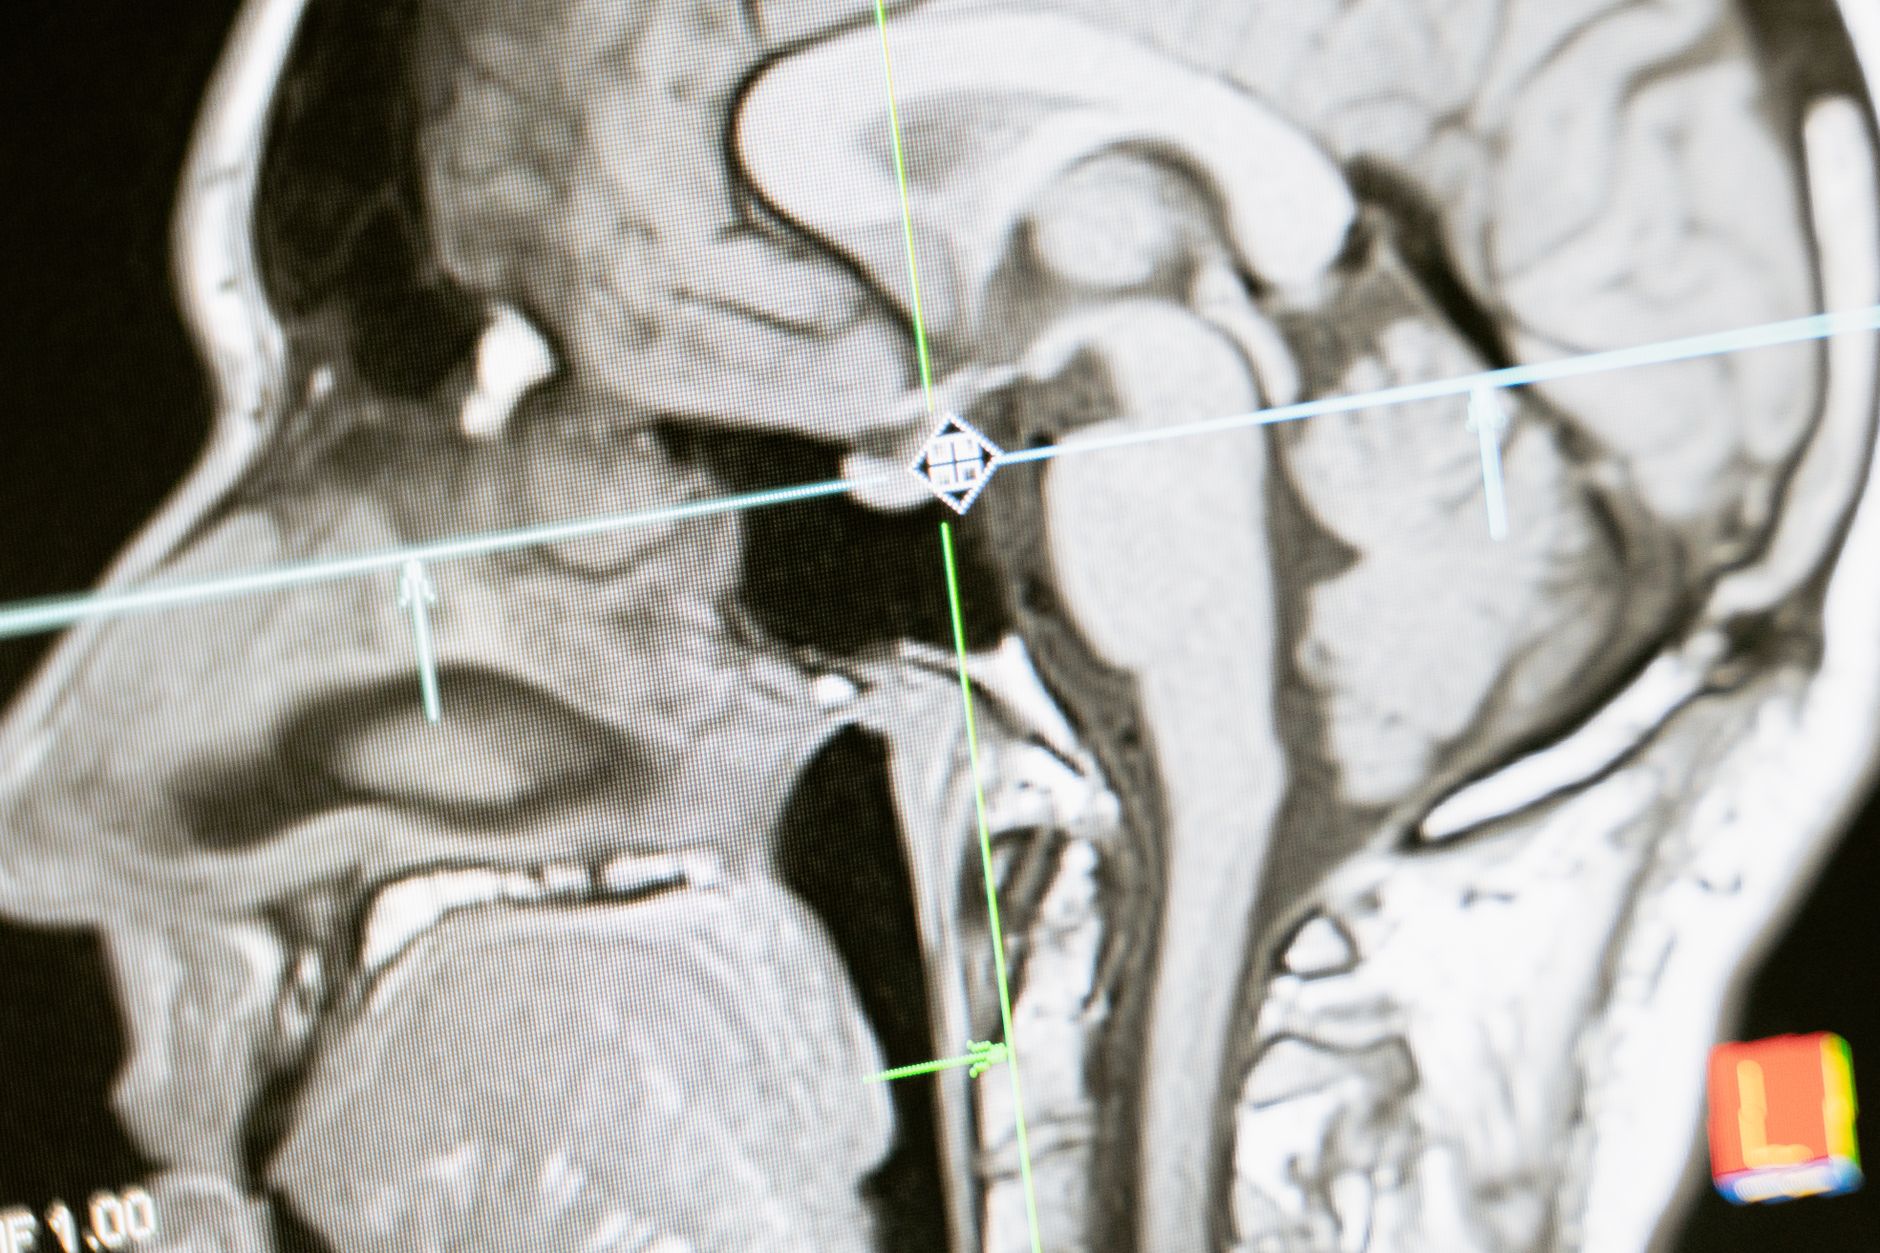
The choice of regions is not arbitrary. It follows the well-described topography of early-onset Alzheimer’s, which tends to be less hippocampus-dependent and more parietotemporal than the late-onset form. Instead of asking “is the hippocampus atrophic?”, the signature computes a composite cortical thickness score across those eight areas and compares it against the distribution seen in cognitively normal, age-matched controls. The output is a number of standard deviations — something a radiologist can put in a report and a neurologist can track over time.
Turning images into a reproducible metric is the same logic we covered in brain motion MRI used for surgical prognosis in Chiari malformation: the gain comes not from better hardware but from extracting a number out of the scan you already have.
What the study measured
The team led by Alexandra Touroutoglou, PhD, of Harvard Medical School followed 130 people aged 40 to 64 with MCI attributed to early-onset Alzheimer’s disease, plus 97 cognitively normal participants in the same age band who served to build the normative reference. Everyone had a baseline MRI and at least one annual follow-up visit, with mean follow-up of roughly two years.
The endpoint was hard and clinically meaningful: conversion from MCI to dementia — the point at which a person stops being functionally independent. Over follow-up, 84 of 130 patients, or 65%, progressed. Greater baseline atrophy within the EOAD signature was associated with faster progression, with a hazard ratio of 1.24 per additional standard deviation of atrophy. And the finding that matters most in practice: the imaging marker added prognostic accuracy beyond baseline clinical severity. It was not simply a proxy for “this patient is already worse”.
“Better tools are needed to predict when someone with early-onset Alzheimer’s disease may lose independence and progress from MCI to dementia,” the authors wrote — a sentence that neatly frames the gap the study tries to fill. The work appeared as EOAD-Signature Atrophy Predicts Dementia in Early-Onset MCI due to Alzheimer Disease (DOI 10.1212/WNL.0000000000218519).
Why age of onset changes the problem
Alzheimer’s before 65 is a different disease in practice, even when the molecular pathology is identical. The patient is usually economically active, with dependents, an employment contract, a mortgage in progress. The question asked in clinic is not “do I have Alzheimer’s?” — that diagnosis has landed. It is “how long until I can no longer work?” Prognosis, in that setting, carries legal and financial consequences, not just clinical ones.
There is a research dimension too. Trials of anti-amyloid antibodies need to enrich their samples with patients who will progress inside the study horizon; otherwise the placebo arm generates too few events and the trial loses statistical power. A cheap imaging marker that stratifies speed of progression shrinks sample size and recruitment cost. It is the same move seen in precision oncology, and the same one we tracked in the FDA clearance of Lantheus’ tau PET agent for Alzheimer’s: imaging stops being confirmatory and starts being a selector.
Implications for the report and the service
Three practical consequences deserve attention from anyone running an imaging service. First, acquisition: the signature depends on good-quality, near-isotropic volumetric T1 with motion under control. If the department’s dementia protocol still runs 2D T1 with thick slices, no quantitative analysis will work. Revisiting that protocol costs an afternoon of medical physics time and no hardware.
Second, workflow. Automated volumetric analysis runs in minutes but needs a defined path — who orders it, where the output is stored, how it lands in the structured report. Services already running neuro post-processing can bolt on cortical thickness with little friction; those that are not have to decide whether their dementia volume justifies the investment.
Third, communication. An atrophy score is a number with uncertainty, not a verdict. Translating “1.8 standard deviations below the age-matched mean” into language a neurologist and a patient can absorb without hearing a prophecy takes editorial care — the same care behind the ACR guidance on patient-facing report summaries.
Limitations and what comes next
The study’s constraints are explicit and they matter. The signature was developed and tested in a single population, predominantly non-Hispanic white, leaving generalizability open — cortical atrophy varies with education, vascular comorbidity and ancestry, and a map calibrated in Boston may not travel cleanly to a Brazilian cohort. Two years of follow-up is short for a disease that unfolds over decades, and a hazard ratio of 1.24 per standard deviation, however statistically solid, describes a population trend rather than an individual destiny.
The logical next step is external multicenter validation in diverse cohorts, followed by head-to-head comparison against the fluid biomarkers — plasma p-tau217 above all — that now dominate the Alzheimer’s diagnostic conversation. The likeliest outcome is not replacement but combination: blood to say whether amyloid pathology is present, imaging to say how much cortex is already gone and how fast it is going. In that arrangement, structural MRI stops being the exam that “rules out other causes” and becomes the clock on the disease.
Source: AuntMinnie — MRI-based biomarker tool can predict progression to dementia